Press Release: 6/11/2021
Massachusetts Weekly Unemployment Claimant Data 06-10-21
Massachusetts Weekly Unemployment Claimant Data 06-10-21:
FOR IMMEDIATE RELEASE: 6/10/2021
MASSACHUSETTS — Massachusetts Weekly Unemployment Claimant Data
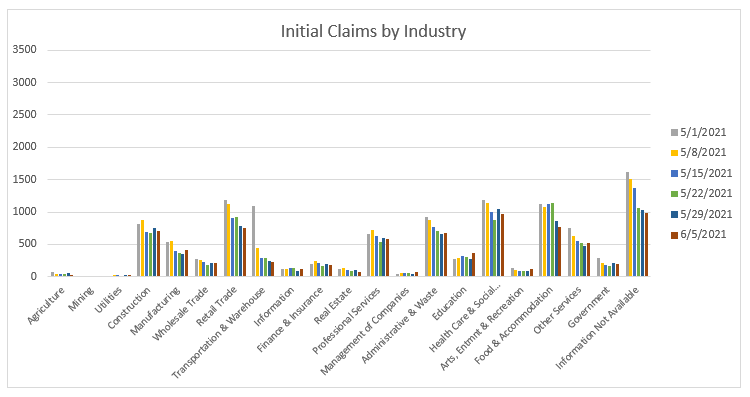
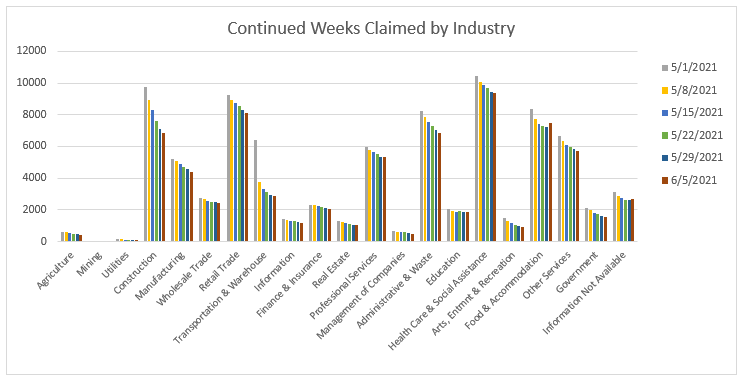
For week ending June 5, Massachusetts had an estimated 8,016 individuals file an initial claim for regular Unemployment Insurance (UI), a small decrease of 63 claims from the previous week. Decreases and increases in initial claims were spread out among all sectors. The largest decreases in initial claims filings seen in Food and Accommodation, down 94; Health Care and Social Assistance, down 87; and Construction, down 44 claims. Notable increases in filings were posted in Education, up 93; Manufacturing, up 69; and Other Services, up 57 claims. (Please note that due to a system processing error, initial claims filings for regular UI for the current and prior week are estimated values and included here as reported to the Employment and Training Administration. The corrected values will be provided when they become available.) Continued weeks claimed for week ending June 5 decreased by another 1,253 to 73,862 its lowest level since mid-March 2020.
From May 30 to June 5, the Pandemic Unemployment Assistance (PUA) program had 882 initial claims filed, now totaling of 973,944 claimants filing an initial claim for the PUA since April 20, 2020. PUA continued weeks claimed for week ending June 5 decreased by 1,316 to 226,698 the fifth week in a row of decline.
The Pandemic Emergency Unemployment Compensation (PEUC), which provided up to 13 weeks of extended benefits, was implemented on May 21, 2020. PEUC initial claims filed at 5,661 for week ending June 5 were 2.337 less than the previous week. PEUC continued weeks claimed were at 220,917, down 3,982 from the prior week.
The federal/state Extended Benefits (EB) program, which first triggered on May 3, 2020 due to the high volume of claims, from May 30 to June 5 had 327 initial claims filed and 2,451 continued weeks claimed.
Initial Claims Filed
Industry | Week Ending 5/29 | Week Ending 6/5 | Change | % Change |
Agriculture, Forestry, | 53 | 33 | -20 | -37.7% |
Utilities | 24 | 26 | 2 | 8.3% |
Construction | 747 | 703 | -44 | -5.9% |
Manufacturing | 346 | 415 | 69 | 19.9% |
Wholesale Trade | 215 | 217 | 2 | 0.9% |
Retail Trade | 789 | 750 | -39 | -4.9% |
Transportation and | 241 | 232 | -9 | -3.7% |
Information | 97 | 120 | 23 | 23.7% |
Finance and Insurance | 192 | 182 | -10 | -5.2% |
Real Estate | 100 | 75 | -25 | -25.0% |
Professional and | 593 | 581 | -12 | -2.0% |
Management of Companies | 43 | 72 | 29 | 67.4% |
Administrative and | 659 | 679 | 20 | 3.0% |
Education | 279 | 372 | 93 | 33.3% |
Health Care and | 1,050 | 963 | -87 | -8.3% |
Arts, Entertainment and | 85 | 116 | 31 | 36.5% |
Food and Accommodation | 858 | 764 | -94 | -11.0% |
Other Services | 468 | 525 | 57 | 12.2% |
Public Administration | 214 | 202 | -12 | -5.6% |
Information Not Available | 1,026 | 986 | -40 | -3.9% |
Demographic Breakdowns
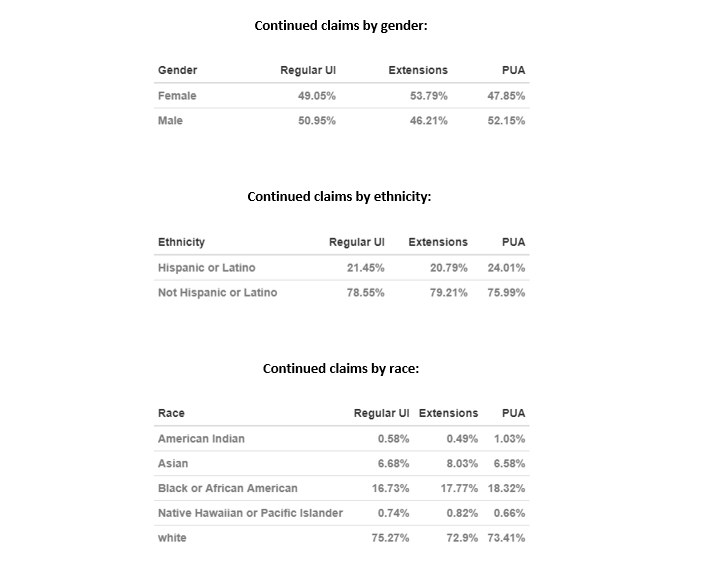
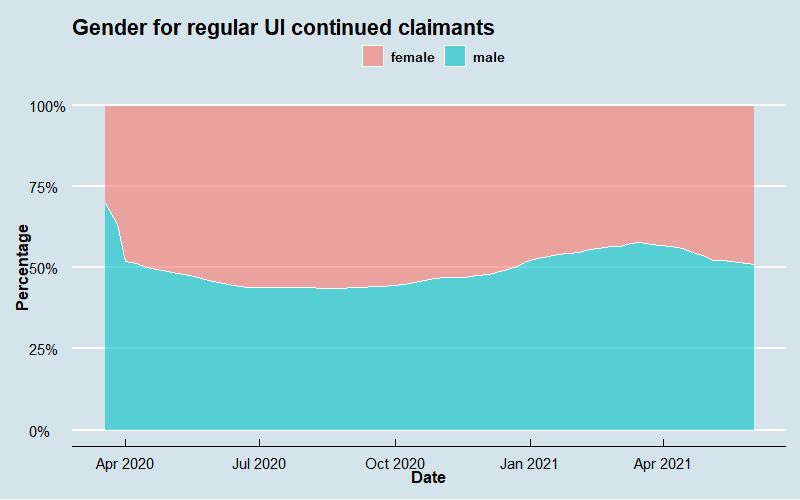
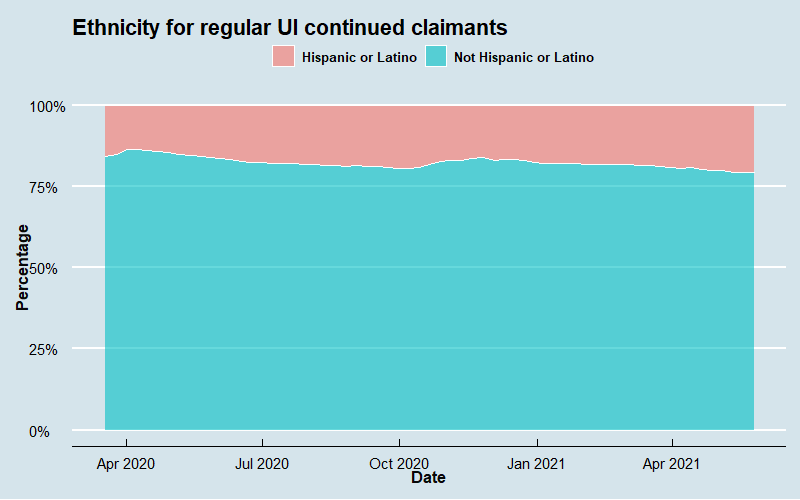
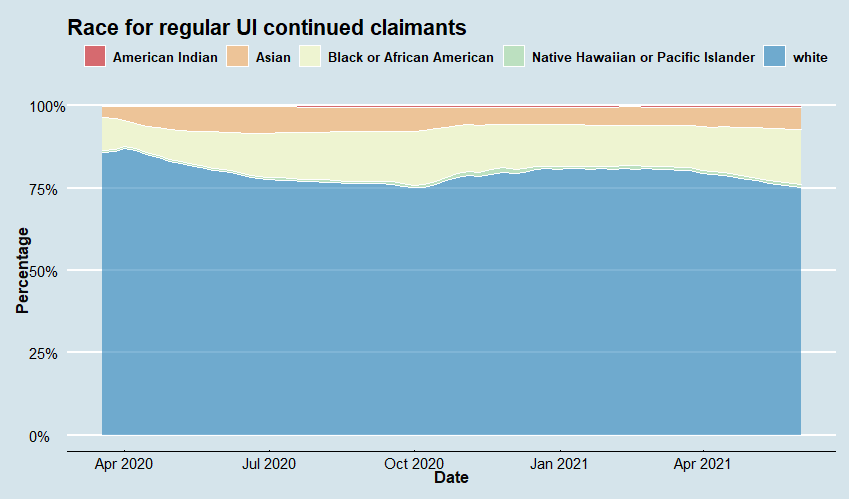
Below we present demographic statistics on ethnicity, gender, and race for all those claimants who filed for a continued week in the period prior to the above information. This is to say that because of the timing of data availability, the below statistics reflect continued weeks claimed in the week ending May 29th rather than the week ending June 4th. All demographic information is presented as a percentage of claimants who responded, excluding claimants for whom the information was not available.
Regular UI Demographic Series
Here we present the breakdown by gender, ethnicity, and race of continued claims for Regular UI between March 8th, 2020 and May 29th, 2021:
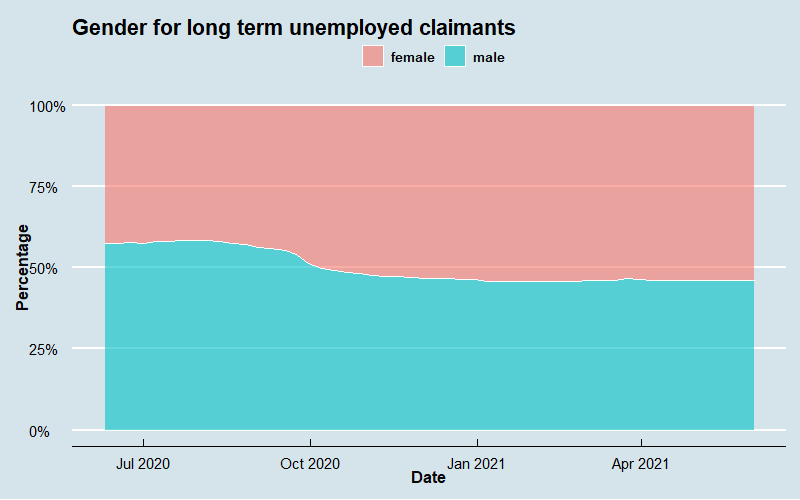
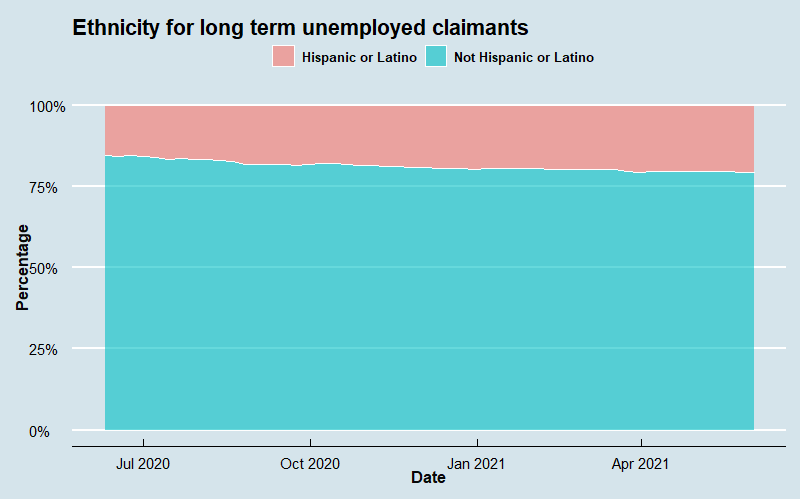
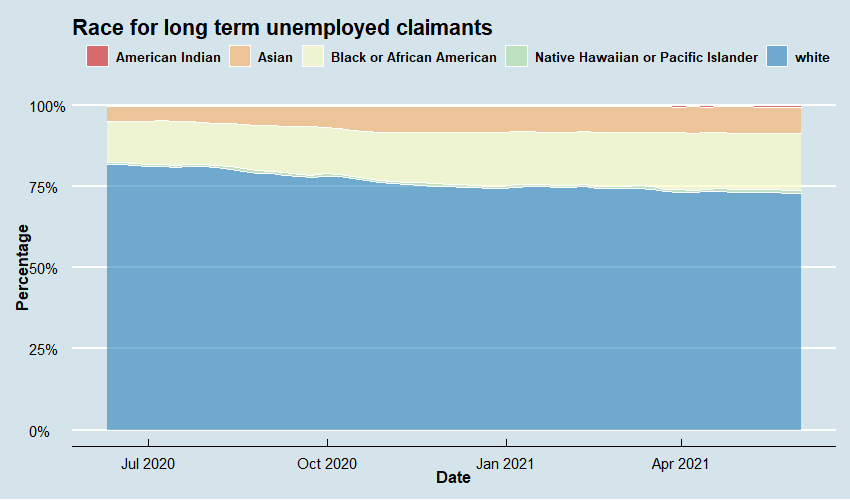
UI Extensions Demographic Series
Here we present the breakdown by gender, ethnicity, and race of continued claims for the PEUC and EB programs, which cover the long term unemployed, between May 31st, 2020 and May 29th, 2021:
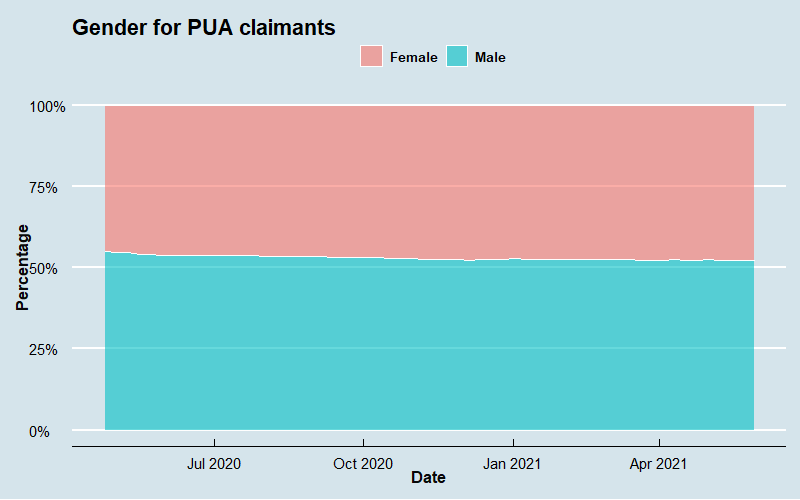
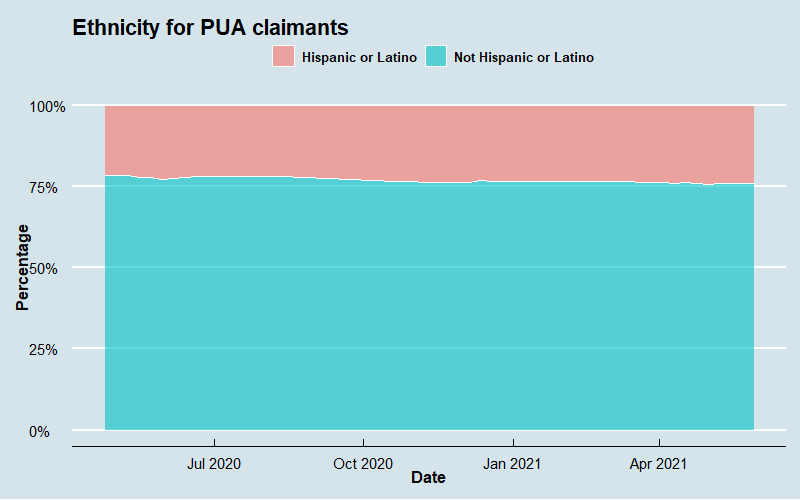
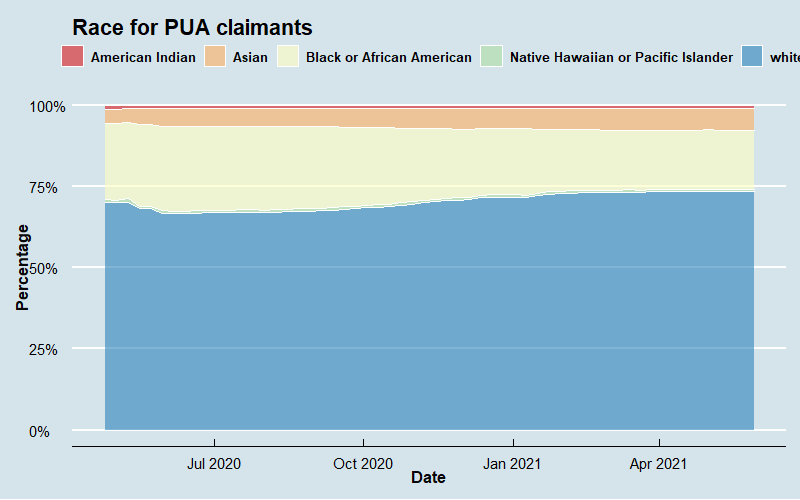
PUA Demographic Series
Here we present the breakdown by gender, ethnicity, and race of continued claims for the PUA program, which covers the self-employed and others not eligible for traditional unemployment insurance, between April 19th, 2020 and May 29th, 2021: